New Analytics Make Measuring Your LoyJoy Success Easier
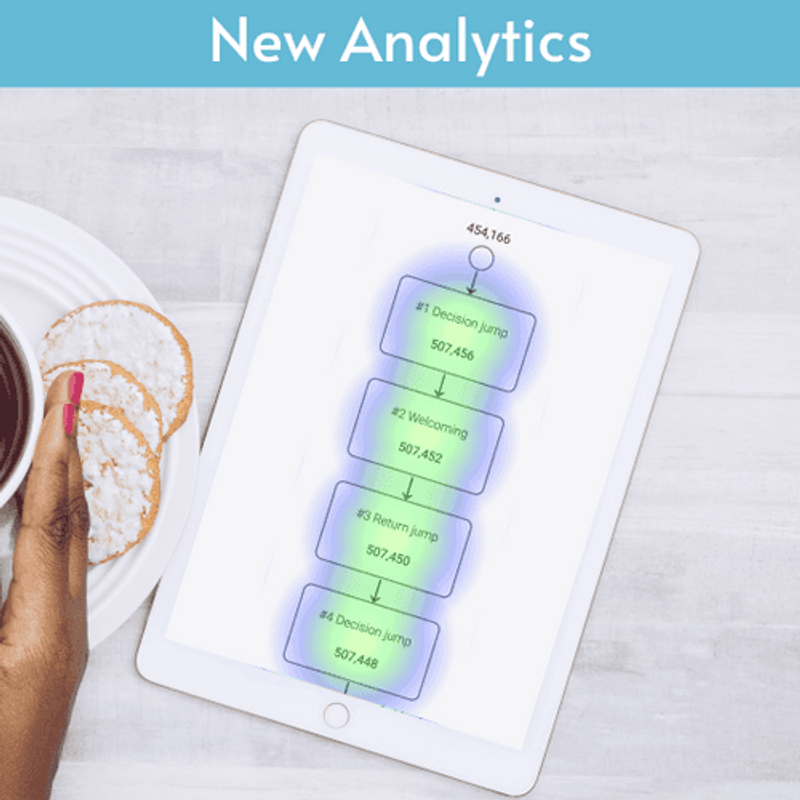
As a frequent user, you are familiar with our Live Analytics where you will find general KPIs such as the screen time, participants, and newsletter subscribers for each of your chat experiences. Depending on your chat experience, you will find information on your customers’ behaviour in the chat.

New Detail View With Heat Map
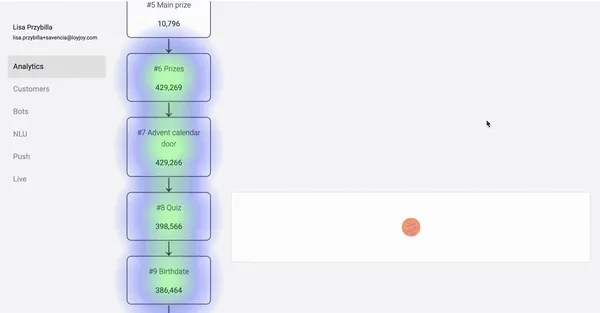
In addition to these KPIs, it is now possible to assign the analytics to specific categories. This allows displaying the performance per process module.
It now looks like this:
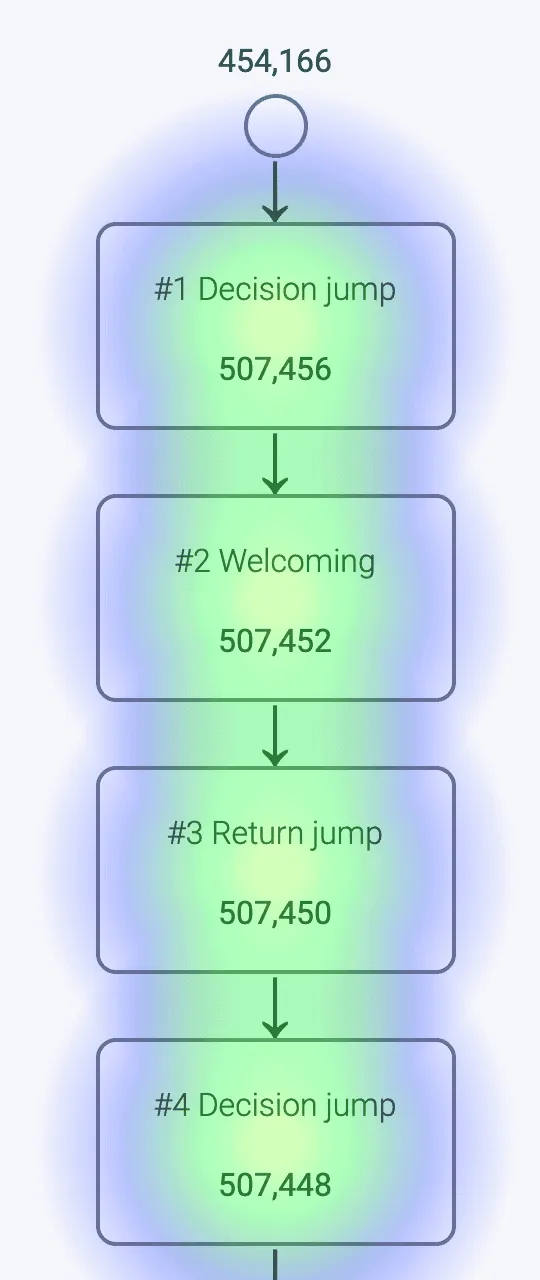
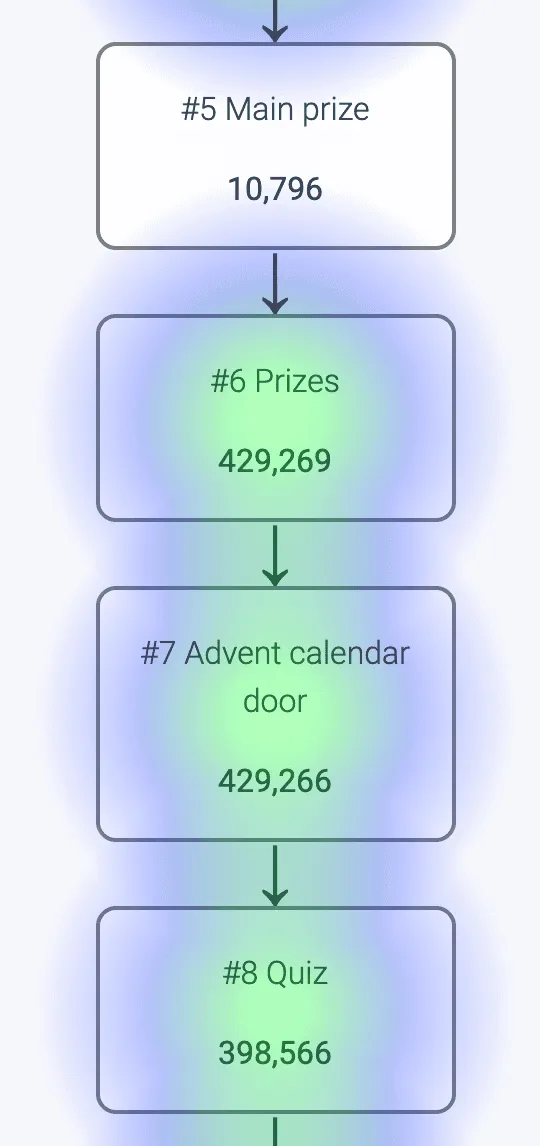
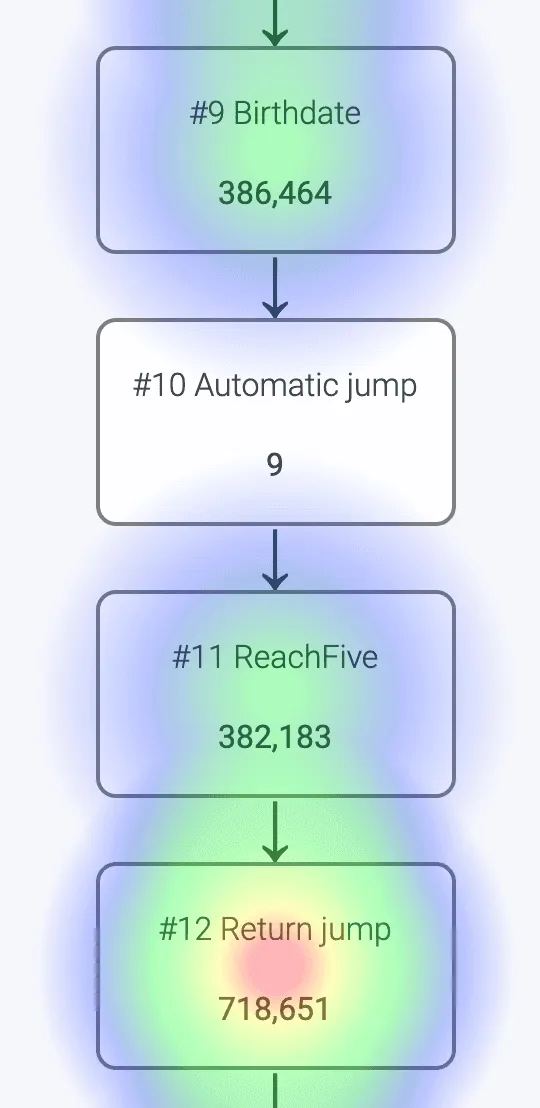
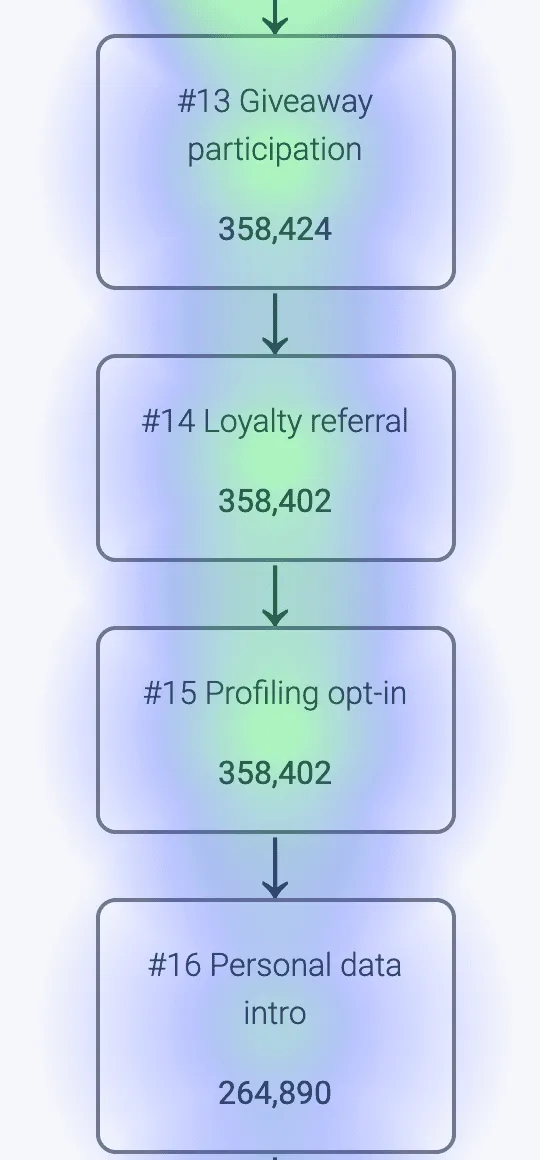
If you click on a module, you can view all the details.
New Session Concept
The chat opens and interactions within 30 minutes are measured. They are measured every 30 minutes again to get better results. The same concept is used by Google Analytics.
New Bot-Wide Analytics
On top of that, there are now new, bot-wide analytics with aggregated performance measurements. You can click on the chatbot and you will get analytics for the whole bot, which was not possible before.
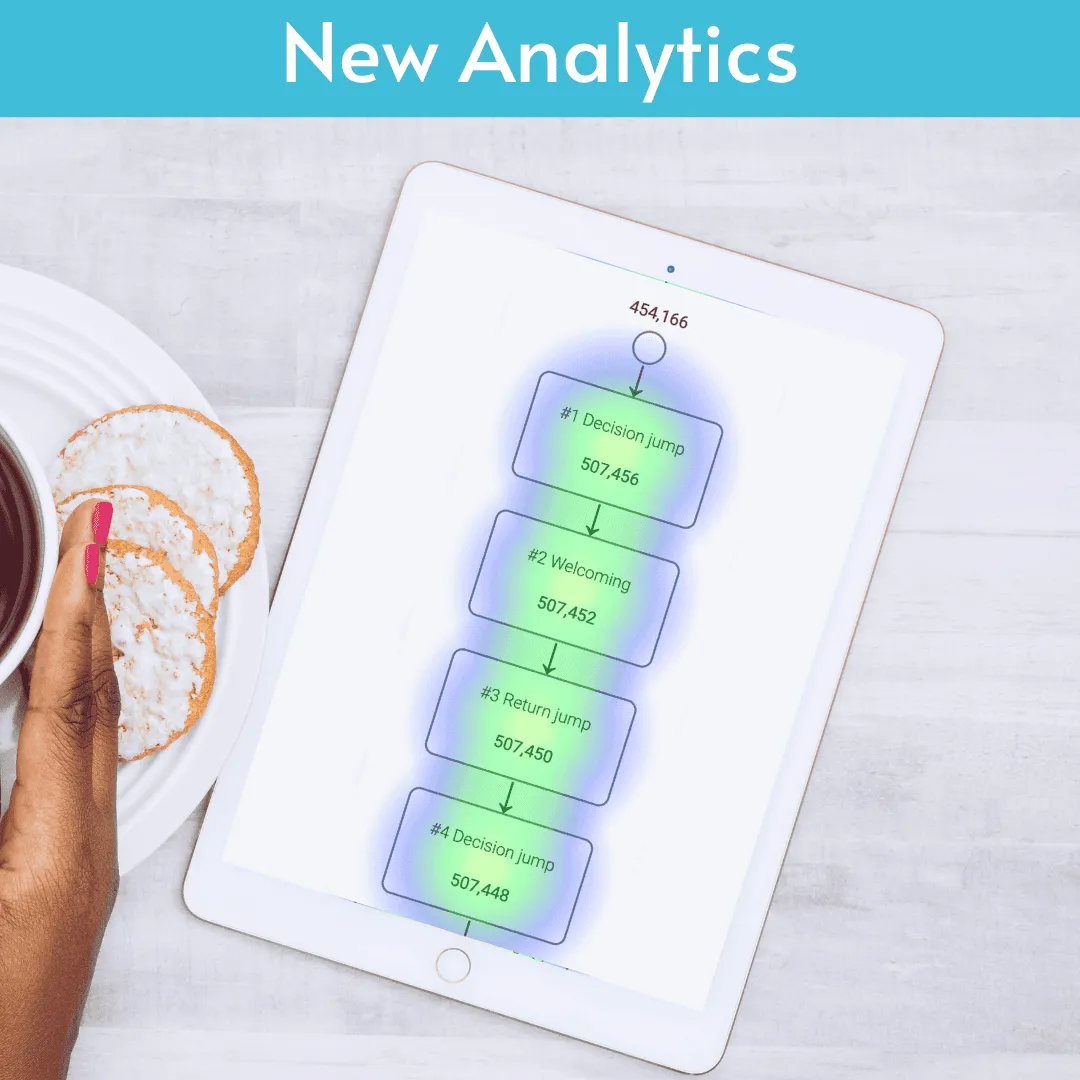
All these features are already waiting for you on the LoyJoy platform.